

We have written in the past about the Spearman Indicator and how it is a decent tool for over-bought and over-sold signals. We often use this as a secondary measure to confirm the potential for a change of trend.
For the most part, the best use of this is for severe oversold condition within a security or market that signals the extreme exhaustion levels of selling. In fact, over longer-time frames it has done a pretty good job at calling some important bottoms. On the other hand, it is not as good at calling tops – similar to most trend oscillators.
Just as a refresher, The Spearman Indicator, also known as the Spearman Coefficient, at the bottom of the chart is derived from an analysis of the correlation between an actual price series and a sorted list of the same series. The result is a comparison of the volatility of a security with an efficient price trend. A breakdown in the correlation of price changes will result in a reversal of the oscillator, signaling a trading opportunity. A value of -80 implies persistent negative trading. When this reverses upward, the correlation is breaking down, signaling a chance in the underlying directional bias. When the oscillator crosses above -80 that may be interpreted as a buy signal. When it crosses below +80, that‘s a sell signal.
For this monthly time-frame we decided to move the outer boundaries to +90 and -90 to see where those signals may be presenting the greatest opportunities. Also, crossing the zero-line can often be interpreted as a confirmation (or break) of the trend change after it break above or below the outer boundaries.
The S&P 500 Index
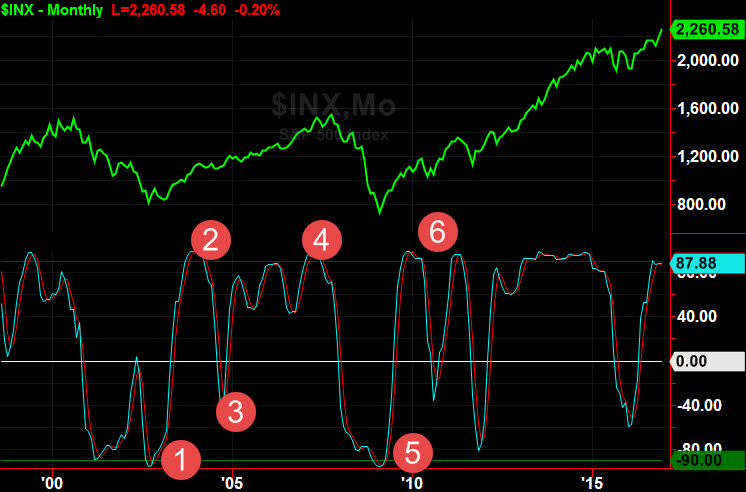
(Spearman indicator in light blue, 3 period SMA in red)
#1 and #5 – Signals bottoms below the -90 that crossed above and then rallied from oversold levels
#2 – Signal crossed below and through the zero line and the S&P 500 changed to a downtrend for a very short time before a quick turn
#3 – Crossing above the zero line was indication that the downtrend was probably broken
#4 – Another cross above and then below the +90 with a continuation down to -90
#5 – Severe oversold condition that prompted buying into a new uptrend
#6 – Two tops that could not be sustained showed that an overbought condition signal was evident. Both downtrends interrupted by crossed below and then above the zero line
Current Trend/Signal – At the close of the month on 9/30/2106 the Spearman moved above +90 then crossed below. However the slope of the Spearman is not necessarily indicating a change of trend at this time. In fact, the Spearman is still above the SMA and until that cross is seen, the current trend is still confirmed.


