Last night I was reading some interesting commentary that stated that the Hindenburg Omen, a somewhat obscure technical indicator, had been triggered. However, just the day before, I was reading Tom McClellan’s daily commentary which explicitly stated that only parts of the equation that make up the signal had been confirmed. Conflict and confusion….
The first article I read stated the indicator was triggered was written by StockCharts.com. Aurthur Hill, a noted technical analyst put out a post that showed the various reasoning as to why the Omen was now active.
The day before, blogger Andrew Thrasher wrote about it on ForexPros, confirming it as well.
However, after looking at the charts and indicator that I follow, I disagree.
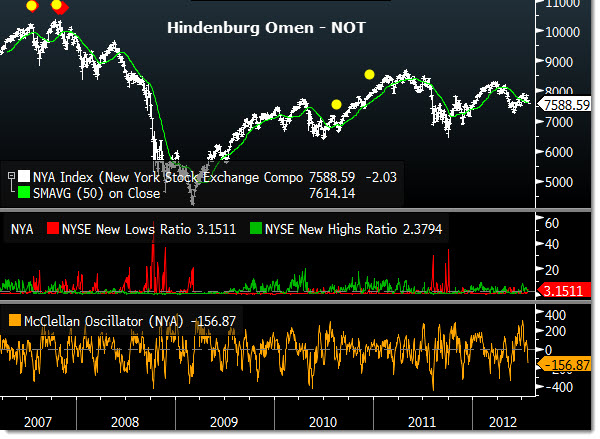
Below is a chart and indicator created by the technical chart team at Bloomberg. I conferred with Bill Sindel (my tech/chart guru) and he agreed that the indicator was NOT triggered. (It would have a colored notation above the date on the chart)
Tom McClellan also confirmed in an email to me that the conditions were not met. Referring to the Aurthur Hill, Stockcharts.com article:
“One of the criteria cited in that article is incorrect. He states that $NYA was above its 50MA, but that is not the correct criterion as published by James Miekka. Instead, the criterion is that this 50MA (or 10-week MA of weekly closes) has to be rising, which it was not.
This does not preclude the condition of NH and NL both exceeding the threshold from being bad news. It just means that it does not qualify
as a Hindenburg Omen event.” Tom McClellan
So, we can all breathe a little easier I suppose.


