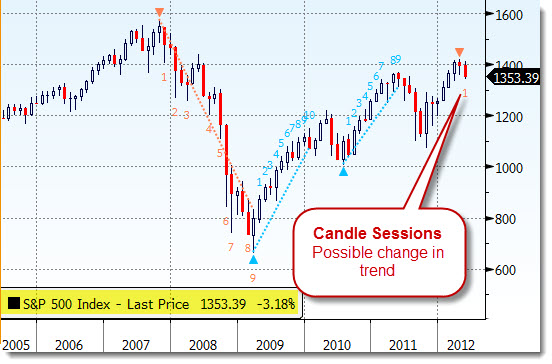
While the actual indicator is not new, it is now available on the Bloomberg Professional platform. My friend Bill Sindel is a whiz at making these indicators come alive on Bloomberg charts. This one I like as it has some interesting applications for a longer time-frame as shown below for the S&P 500 monthly.
On a monthly and weekly time-frame, the trend has now turned down. On a daily basis there was recently a low seen, so a reprieve of the selling may show up for a short time until the next wave will potentially begin again.
Note that this indicator does not call every single move and it is not easy to change the direction of the trend when it is established and the counts begin.
Just some further evidence that equity markets are showing signs of caution.
This Reversal Indicator is based on Japanese candlestick counting. An underlying trend is established by comparing consecutive down/up candles to identify the Record Session Low/High. Thereafter a sequence of opposite moving candles based on High/Low breaks are recorded until the maximum count is reached or until a new Record Session Low/High is found. Potential reversals tend to occur at counts of 8, 10 or 13!
Live and Alerting
(Click the above for more information)


