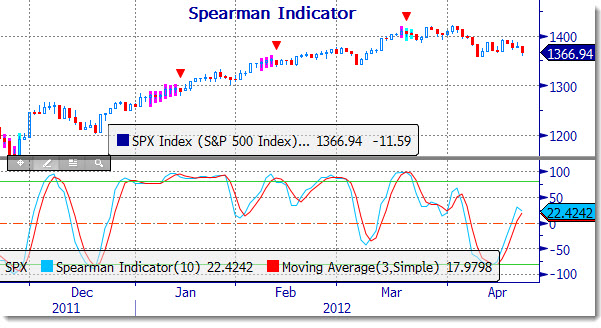
We often look to the Spearman Indicator as a reference point for the level of damage that is being inflicted on the markets in general and the potential for the trend to continue. If the indicator is under zero and heading lower, it is a sign that there is additional lows that should follow. Also, depending on the slope of the trend will show how much the correction or rally has taken the price of the index outside of its “normal” statistical level.
Even though stocks are correcting, the Spearman Indicator shows that much of the damage may have occurred. That is interesting.
Note that the indicator setup line is above the zero point and above the moving average. This is what you would expect to see when stocks start to rebound, not begin a correction cycle. However, the recent oscillation of the past three highs are all now lower than the last. That shows a trend of lower highs and that is a negative sign. So, there are a couple of ways to look at this.
First, there may be a brief rally coming in the near term and that will be a chance to take out profits on positions and further lighten up long positions. In other words there is the potential for a counter-trend rally in short order.
The other way to look at this is simply that the correction will be mild and the slow ride lower will occur at low volatility with a low correlation of stocks to the broad index. This means that it will be a selective market best suited for short-term positioning that favors stock pickers over market timing.
____________________________


