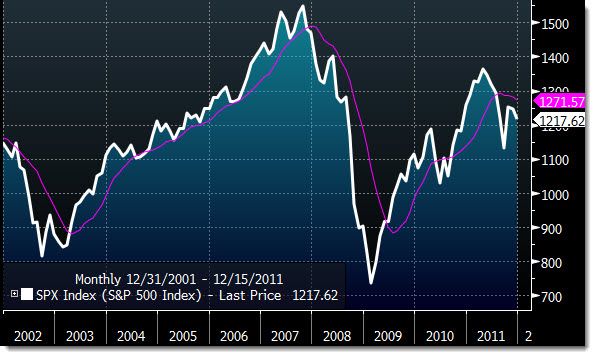
I was speaking with my friend Jon Markman last night and we were discussing market volatility. In that time we also wandered into the area of technical analysis and some of the more important signals that are available. One that both of us have been partial toward is rather simple: A 10-month moving average for the S&P 500 (or other index).
This has historically been rather good at showing a ling-term trend of when to be “in” and when to be “out”.
Thoughts? (Purple line is the 10-month SMA)


