

Horowitz & Company’s QFT Analysis on Hansen Natural (HANS). ![]()
When the analysis and information is made available, we will update this table with the article link(s). Also, notifications will go out via Twitter Follow @andrewhorowitz
Earnings due 11/3/11 after market (approximately 4:10pm)
Here are the important facts and levels to consider:
- Consensus estimates are for $0.88 per share EPS on $464.66 million of revenues.
- Next period the consensus estimate is $0.70 per share with $387.77 of revenue.
EPS surprises over the past few quarters have ranged from +20.4% better to -14.6 % worse than estimates. Positive surprises are often taken well by markets as the stock will tend to move higher. Although misses are punished. Overall the average surprise over history has been +3.37%.
So, look for $0.89 or better for shares to move higher. Anything below $.86 could be punished if revenues are not there.
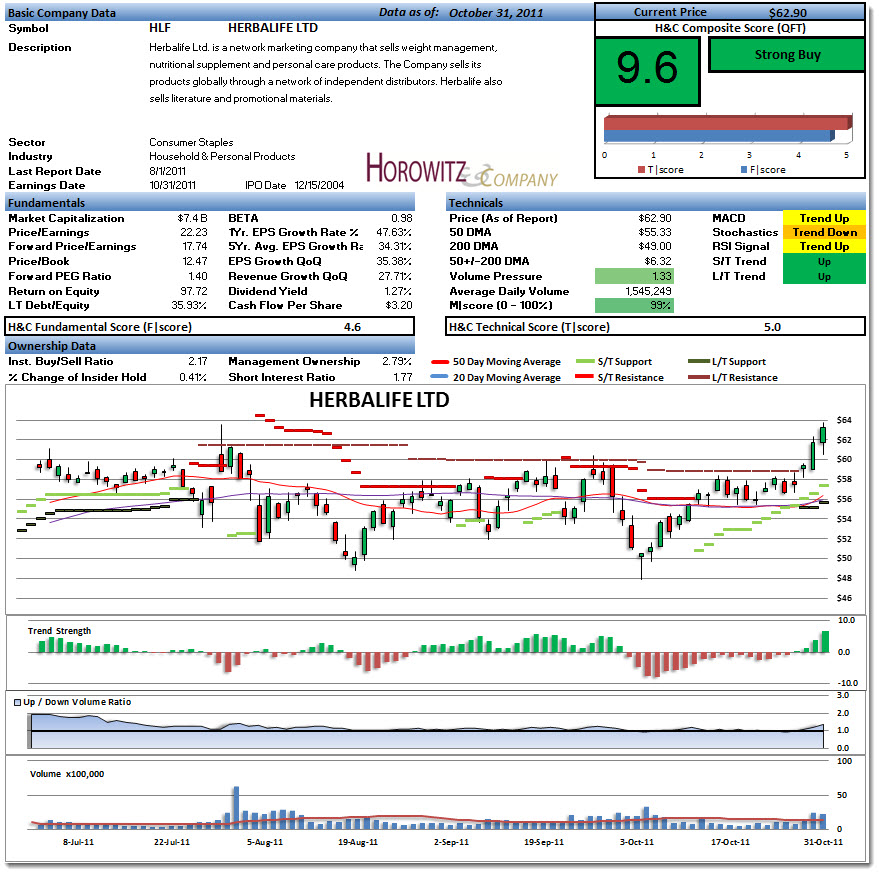
Shares are not too far away from the all-time high of $96.94.. The 50 DMA is $88.06 which will serve as institutional support. On the downside, there is good volume support at $85.58, $84.89. Above $92 and the shares have a good chance of breaking out to new highs as there is little resistance above. That is the point of entry for longs.
The above are short-term trading guidelines, below are more pertinent details regarding fundamentals and the longer time-frame technicals.


Horowitz & Company’s proprietary Technical Scoring System (T|score) takes into consideration both individual security technicals as well as the overall market direction when considering whether or not to purchase a company. H&C’s Market Trend Indicator (MTI) is a measure which is designed to evaluate the overall trend in the market. There are four designated levels to assess the trend which include: Strong Downtrend, Downtrend, Rally and Strong Rally. We are currently in an environment where the MTI is in a Strong Rally. All of our indicators are showing that the markets are in a strong rally and risk is back on. Investors of all risk tolerances may consider moving to a higher level of equities while still looking to pick up companies with increased levels of technicals. With that said, this stock ranks in the mid to below average percentile of stocks from an individual security technical score. H&C would not consider purchasing this position in any general market with the exception of a Strong Rally. H&C would be hard pressed to purchase this position even in a Strong Rally considering all other companies that may score higher technically in our growth model.
Below are some of the areas where Hansen Natural Corp (HANS) excelled or detracted from the value of the technical score:
Stochastics are currently showing some bullish attributes which may mean this stock has some room to run in the short run.
Hansen Natural Corp (HANS) over the past two weeks has recently crossed above its 50 day moving average. We see this as a bullish sign as the momentum is starting to change.
In terms of price and volume especially over a short period of time it is important to see if there is any weight behind either a rally or correction. This company has shown to have less than favorable price action in terms of volume and therefore has a greater chance to move lower if the overall market and economy are to trend lower. Higher volume with negative price also will provide resistance levels for this position if it were to increase back to these levels.
On a 12-month rolling period this company has performed very well when comparing against its peers and equities in the S&P 1500. We see this as a positive sign for this company as it shows strength relative to the overall market
H&C currently sees Hansen Natural Corp (HANS) in a Short Term Downtrend and Long Term Downtrend.
___
Looking to invest in The Disciplined Investor Managed Growth Strategy?
Click HERE for the virtual tour….
___

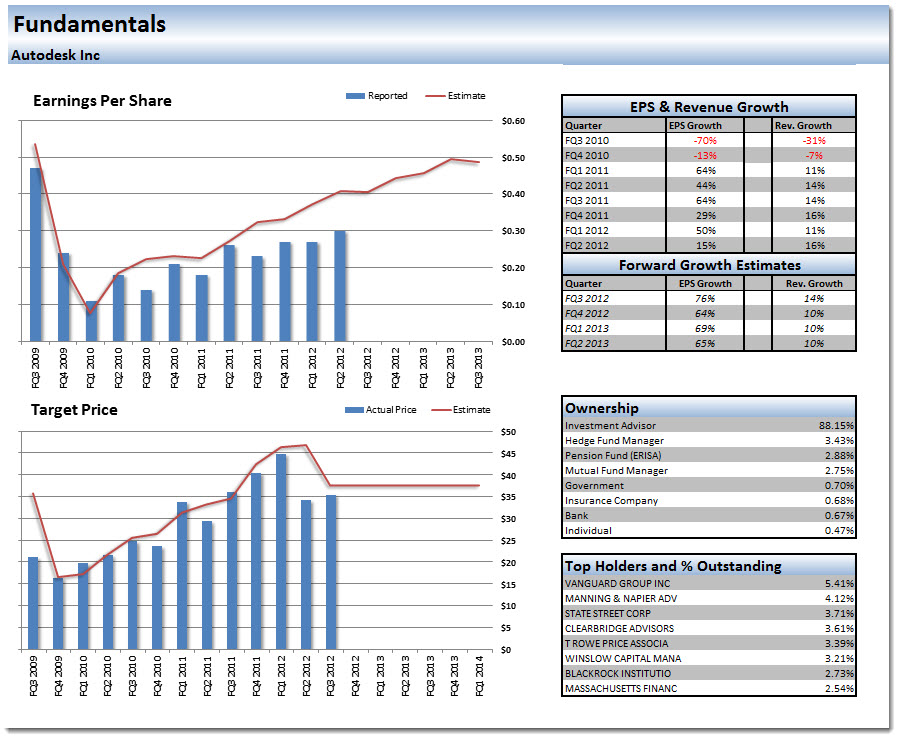
“Horowitz & Company’s proprietary Fundamental Scoring System (F|score) takes into consideration many factors related to each company’s financial history and outlook. This system is oriented toward a growth model and therefore will give a higher score to those companies which continually show increasing earnings per share and revenue over time. Over the long-run (and when looking to purchase a security) we prefer companies with a track record of growth and solid fundamentals. In the short-term however, it is price / technicals that pay. When investing, we combine both of these analyses to seek out possible investment opportunities within our universe of stocks.
This stock ranks average to above average in regard to fundamentals and could be considered as a company that is poised to outperform or that previously was a high flyer now coming back into the stratosphere. See below for details on where this company thrives and possibly some of its drawbacks:
We find that EPS Growth on a Quarter over Quarter basis is one of the strongest components when screening for growth stocks. Continued EPS Growth in a company generally shows strength in leadership, the ability to manage expenses and improve the bottom line.Over the last three quarters, this company has not done as well producing EPS Growth Rates last quarter, 2 quarters ago and 3 quarters ago 30.43%, 68.57%, -7.02% respectively.
Revenue Growth similar to EPS Growth is also a strong component to consider when screening and scoring for growth companies. Continued growth in revenue shows that the company is innovative, marketable and its products remain relevant in the marketplace.Over the last three quarters, this company has done exceptionally well producing Revenue Growth Rates last quarter, 2 quarters ago and 3 quarters ago 26.37%, 49.69%, 9.54% respectively.
The 5 Year EPS Growth Rate has added to the fundamental score with a value of 28.63.
Last quarter this company reported Earnings Per Share 7.14% better than analysts had expected. We believe this surprise although only for one quarter could set a trend for future earnings reports and guidance.
Price relative to earnings growth is commonly referred to as the PEG Ratio. This companies price is further inflated than what we would like to see when compared against growth as it’s PEG Ratio is 1.82. We generally would like to see the PEG ratio under 1.5 and it is even better if it is under 1.0
___
Looking to invest in The Disciplined Investor Managed Growth Strategy?
Click HERE for the virtual tour….
___


