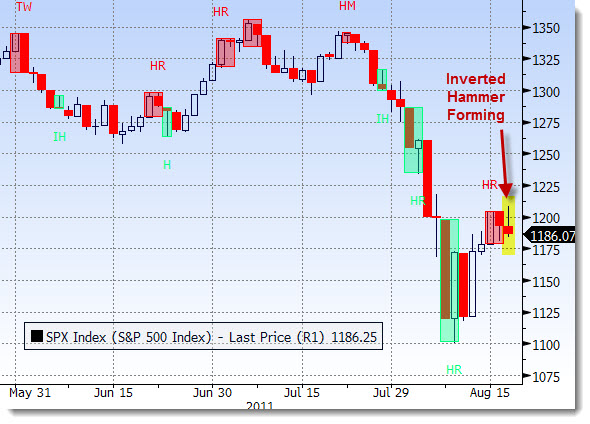
There have been wide swings (no kidding!) in the major indices of late. Most of the downside has come on very active volume. Notice that there has been a short consolidation, then we notice what can be considered a 3-day “trend” higher. Now, there is a bearish reversal pattern which has shown up. For the chart below, there have been a good many patterns that have been calling for caution. Now the Inverted Hammer is providing us with an additional signal that reveals a potential reversal pattern.
___
Looking to invest in The Disciplined Investor Managed Growth Strategy?
Click HERE for the virtual tour….
___
From Investopedia:
The Inverted Hammer looks exactly like a Shooting Star, but forms after a decline or downtrend. Inverted Hammers represent a potential trend reversal or support levels. After a decline, the long upper shadow indicates buying pressure during the session. However, the bulls were not able to sustain this buying pressure and prices closed well off of their highs to create the long upper shadow. Because of this failure, bullish confirmation is required before action. An Inverted Hammer followed by a gap up or long white candlestick with heavy volume could act as bullish confirmation.


