A few interesting readings on important indicators. At the end of last week’s client update, we mentioned that there is a potential for a short-term bounce for markets. While any one indicator can not provide a clear picture of the markets and the overall sentiment, these are a few that are recently flashing a distinctly “overly bearish” statement by investors.
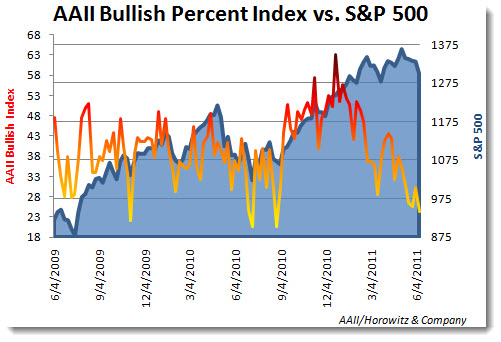
The AAII Bullish Index is often a contrary indicator. Some say that the retail investor is “dumb money” and a good contrarian indicator. Notice that the low points of bullish sentiment often occur at market bottoms. Also notice that that high bullish readings occur at key market tops. We see this as a gauge of short term sentiment, used in conjunction with other extreme readings that can “call” a short-term top or bottom.
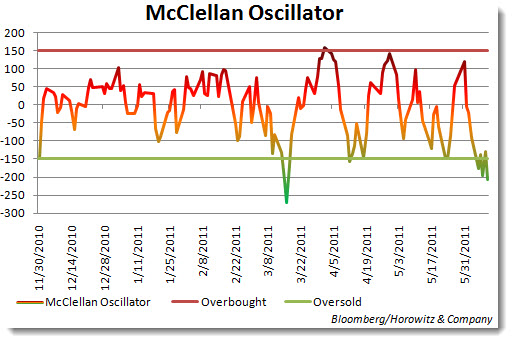
The McClellan Oscillator is also driving below the level considered to be oversold. It is very important to note that this is by no means a guaranteed indication that there will be an immediate turn. It does help to see when selling may be exhausted and again a short-term top or bottom. The fact that the reading has been creating a pattern below the zero line is negative. Back in March, the level moved as low as -275, one of the lowest readings seen in years. Sharp moves above or below zero are also indicative of mass selling by institutions. They have the power to unload or buy shares that become market moving events. However, institutions are usually patient and will allow markets to cool before they step in again as they have no desire to sink their entire portfolio before they can sell out their positions.
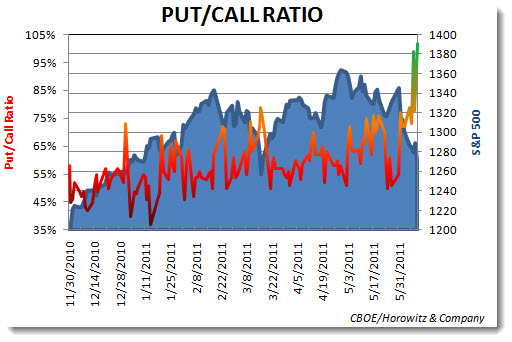
The Put/Call Indicator has reached a point that there are more than 100% put buyers than call buyers. In other words, bets on a decline are not only in the majority, they are overwhelming. This has a similar result as the short interest rising to high levels. Once (if) a bounce occurs, it can be furious to the upside.
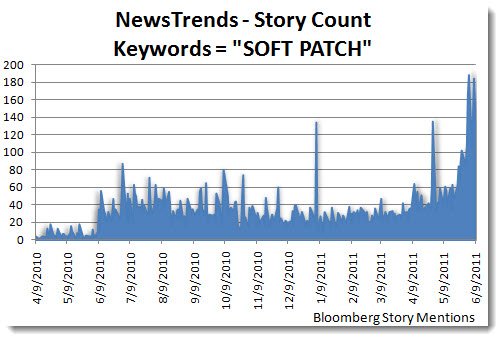
Now, looking at the news, the story count for the words SOFT PATCH has been peaking. This shows that stories published on the Bloomberg system are becoming more consistent with an economic downturn. It also means that many analysts and economists are starting to become more bearish. Often times, this will provide for earnings downgrades and economic assumptions to be cut. The more this occurs, the greater the chance for upside surprises. This is one of those oddball areas that we actually like. Since estimates are often too far ahead of themselves on both sides, the opportunity for surprises when downward revisions are occurring are more likely – although not absolute. To make this clear, estimate revision are NOT good, but if they move too far in either direction, it provides some additional wiggle room for the actual numbers to beat or miss.
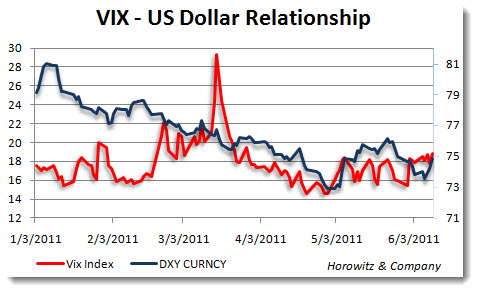
The correlation of the VIX and the U.S. Dollar continues. This spills over to the the equity markets as well. But, even though the U.S. markets have corrected 8%, there is still a good deal of either complacency or embedded optimism. As the VIX is still well under 20 at this stage, there is minimal fear developing in the markets. Even as the put/call ratio is peaking, the overall VIX has not come close to levels we saw in March. This one could go either way, but the idea that government will not let the economy fail is well implanted in investors minds at this point.
In a note to clients today, David Kostin of Goldman Sachs had this to say:
Discussions with clients this week focused on the risk/reward balance for US equities. Our forecasts reflect a 2:1 upside/downside return profile through year-end 2011. S&P 500 has declined by 5% from its April 29th closing high of 1364. Our year-end 2011 index target remains 1450 representing 12% upside from current levels. A downside scenario suggests an index value of approximately 1210 or roughly 6% below current levels. During the pull-backs the median length time for the market to reach bottom equaled 27 days. Six of the episodes took 20-40 days and on four occasions the decline occurred in less than two weeks. The current sell-off has lasted 41 days and counting. The historical episodes we analyzed had a median time to recover of 41 days. Recoveries during 2003-07 typically took longer than the speedy rebounds since 2009.
That report also noted that there have been a spat of economic disappointments that have set the tome for this correction, yet earnings estimates and outlook have changed little:
Earnings: S&P 500 consensus 2011 and 2012 earnings estimates are up during the past month. The same is true for six of ten S&P sectors. Our earnings revisions sentiment indicator, which measures the balance of positive and negative revisions, is also positive for eight sectors. Broadly speaking, earnings estimates have risen for the market and most sectors, providing support for fundamental investors ahead of the 2Q earnings.
If true, then this correction has all the makings of providing a similar pattern to others that will cause stocks to snap back two weeks or so prior to the beginning of the next earnings season – which begins on July 11. So, that would mean that the remainder of June could be choppy and a run-up into earnings starts in July. Something to consider.
It is going to be a busy week for economics. Both in the U.S. and on a global basis.
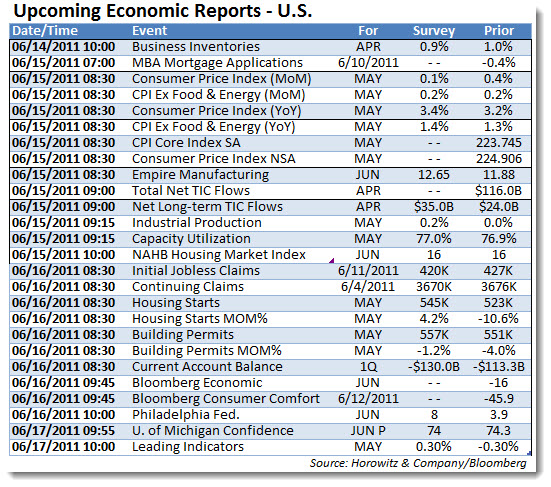
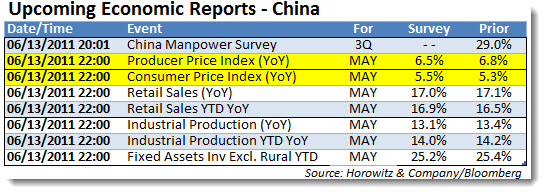
On Monday night, China will release the CPI and PPI numbers. There will be a good amount of interest in this as it will be a key measure to see if the economy is overheating. A number above the estimates will signal additional rate hikes or other tightening measures. That will not be a good sign as already there has been a slow-down occurring. Anything below 5.3% on the CPI should provide a lift for markets.
