For some time, there have been questions about the veracity and the ability for the market to sustain a prolonged rally. Questions have been asked such as: Is it real? Is it safe? Will it turn down again?
Many of the concerns were due to several meaningful components that made up the rally from the devilishly low point in March of 666, reached by the S&P 500 index. Since then, stocks have been on fire and recovered all of the 2009 losses and more. But why so many questions?
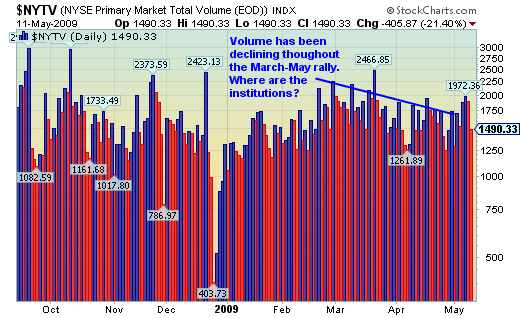
For one, volume has always been suspect. Traditionally, a market rally would start slowly and then grow as more participants believed they could put their hard earned money to work to earn a rate of return greater than money market funds or other competing assets. As the rally progresses, more investors become desirous of investing and volume begins to swell. That has not happened this time around, just as it hadn’t during the past few bear-market rallies. As a matter of fact, most of the high volume days came when the markets were down. This is not a sign of a healthy market rally.
This rally has also been classified by many experts as a junk rally. This occurs when the riskiest asset classes significantly outperform quality investments. Some market pundits believe this is the work of quantitative funds going through a massive deleveraging process. These are hedge funds that run mathematical models that predict risk and reward in assessing investment arbitrage opportunities. As a simple example, many quant models look to short (sell) those stocks with the worst fundamental outlook and buy (long) those that are calculated to have a higher level of quality.
(Listen to MSN’s Bill Fleckenstein on TDI Podcast 108: Commodities and Contrarians)
Simple Quant Strategy: Buy the good stocks, sell the bad stocks.
Lately, this market rally has thrown the quant models a curve ball again and again. These models are run by powerful computers making millions of calculations per second throughout the trading day in order to post gains on lightning-fast price aberrations.
To see what was going on under the surface of the market that we usually see represented by the Dow Jones Industrials and the S&P 500 index, we recently completed a study* to find what, if any, difference the market rally has on high volatility stocks as compared to low volatility stocks.
Interestingly, the lower volatility stocks (think of these as the stocks with solid/quality fundamentals) were up a paltry 5-8% on average, with many down during the period. This is once again showing us that we could be in line for a very big change once there is a shift in trend.
More concerning, though, was the fact that the greatest volatility stocks contained mostly financials and a few retail stocks with a smattering of other sectors represented. That grouping had a range of returns of 50-100% and on average was up almost 60%. What this says is that much of the recent rally was made up of the kind of stocks that the very active quant funds had been shorting. This created a need to exit short positions (also known as a short-squeeze), which in turn pushed shares higher, creating the need to continue to cover positions that moved higher than the quant models would allow. The process repeated itself over and over, causing many of the riskiest stocks with the worst fundamentals to overshoot most analysts’ target prices by a wide margin.
An example of how this strategy performed during the March-April rally can be seen by studying the JP Morgan Highbridge Statistical Market Neutral Fund (HSKAX). This is available to the public, while many of the larger quant funds are only available to private clients of investment houses such as Goldman Sachs (GS), JP Morgan Chase (JPM) and Morgan Stanley (MS).
HSKAX objective: The investment seeks to provide a long-term positive return. The fund invests in the equity securities that are undervalued and sells short securities that it believes are overvalued. It takes long and short positions selected from a universe of mid- to large-capitalization stocks with characteristics similar to those of the Russell 1000 index. It may also invest in shares of exchange-traded funds.
From March 1 to April 30, the fund lost 0.65% while the S&P 500 gained almost 11% and the NASDAQ was up just shy of 14.5%.
Many bulls have seen this rally as a result of the green shoots that Fed chief Ben Bernanke proclaimed during a speech in March. These economic reports show that the economy is no longer in a free fall that essentially ground business to a halt during the fourth quarter of 2008. For all of us who want to believe that this is true, we have to agree that great bull markets were not created by economic conditions that were “not as bad as last time.”
Who are we kidding? Growth is the major driver when it comes to corporate earnings and we are clearly not in a growth phase, nor does it appear that we will see any significant and actual growth for several quarters to come. However, we wish and hope for better days. Back-to-back gross domestic product (GDP) numbers showing a contraction of more than 6% are no reason to rejoice, even if the economy is assumed to stabilize by the fourth quarter of 2009.
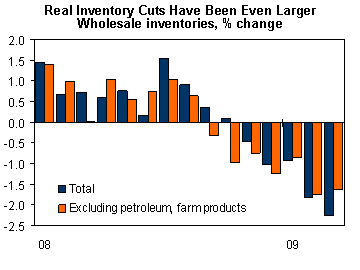
We need much more than a temporary increase in consumer spending, due to the March-April tax refunds/credits, before we can sound the all-clear siren. Even as the latest GDP report revealed that consumption was on the rise, last week we saw the wholesale report that clearly showed inventories are still in decline and sales are continuing to fall. In other words, the economy is not picking up much at this point.
There are also macroeconomic concerns in play that are being discounted. One of the most important is the disturbing level of unemployment and the realization that it is going to climb for some time to come. While we celebrated the most recent release from the Bureau of Labor Statistics that reported “only” 539,000 jobs were lost, the 8.9% base rate of unemployed and the more realistic U6 rate of 15% is not cause to celebrate and drive stocks much higher. The U6 rate is the broadest measure of unemployment, which includes: total unemployed, plus all marginally attached workers, plus total employed part time for economic reasons, as a percent of the civilian labor force plus all marginally attached workers.
As the housing crisis is directly correlated to the rate of unemployment, it is hard to imagine that we will see a quick end to the increasing level of delinquencies and foreclosures. Most economists agree that the first thing that needs to be done is to fix the housing problem, as that is key to correcting the problems within the financial sector.
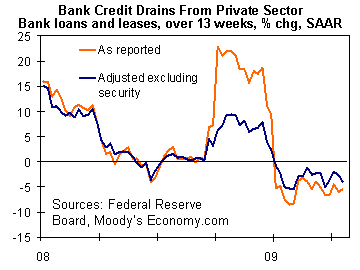
Banks are still not lending, and who could blame them? As the Case-Shiller 20 index shows, prices for the average house continue to decline at an alarming rate. Recently the WSJ stated that “a drop of 18.6% for February is widespread, with half of markets posting steeper declines than in the previous month.” (click HERE for an interactive map of housing prices)
As for the employment number, it is nothing to get to excited about. Much of the decline in the report was due to a well-concealed/temporary hiring of 72,000 census workers by the federal government. If it were not for that, we would still have seen a 6-handle last week (600 or more jobs lost). Even though stock markets tend to rebound much ahead of the worst employment conditions during recessions, remember that we need at least 125,000 new jobs created monthly in order to keep ahead of people entering the work force and immigration trends.
Finally, many stocks have apparently overshot their forward valuations as the exuberance of early recovery signs may have painted too rosy of a color to the green shoots. Excluding financial companies, on average stocks that have reported earnings during this season have outpaced analyst expectations by 10%. The trend is showing revenue coming in much weaker and earnings (EPS) better. How is that possible?
It is due to the massive level of cost cutting that has been occurring, particularly the savings from reducing the cost of employment. Think about it for a second: If we assume 100,000 jobs lost in a week at an average cost of $50,000 per employee based on salary and benefits, that is a savings of $5 billion weekly for companies.
* Note: The date range for the study was from March 1, 2009 through April 30, 2009.


