April 11, 2013
The April 15 income tax filing deadline is just a few days away, so I thought it would be appropriate to take a look at what tax collections have been doing lately. With the federal tax rate increases for 2013 now taking effect, it is not too surprising to see total federal tax receipts rising. The top individual income tax rate rose back up to 39.6%, and the individual Social Security payroll contribution (AKA FICA) returned to 6.2% after being at 4.2% for 2011 and 2012. That latter one means that most wage earners are seeing 2 additional percentage points of their wages claimed by Uncle Sam. 2% does not sound like much, but remember that a jump from paying 4.2% to 6.2% is actually a 48% increase. For the 12 months ending in March 2013, total federal receipts from all sources amounted to 16.2% of GDP. That’s well short of the 18% collection rate which guarantees a recession, but it is rising sharply from recent values. The fact that it is still well short of federal spending at 21.9% of GDP is important, but that’s a subject for another time. Why do I say that collecting taxes at a rate of 18% of GDP guarantees a recession? I only make that assertion because the U.S. has ended up in a recession every single time in the past that it has gotten that high. Some in Washington, DC think that it is different now, and that somehow we can avoid a recession with higher tax collections this time. The 70 years of data which say otherwise do not seem to bother those people. So if we accept that 18% of GDP is a recession threshold, and the last 12 months show it only at 16.2%, then there’s nothing to worry about, right? Not so fast. The data on federal receipts for the first 3 months of 2013 show a big jump in gross tax collections (unadjusted by GDP):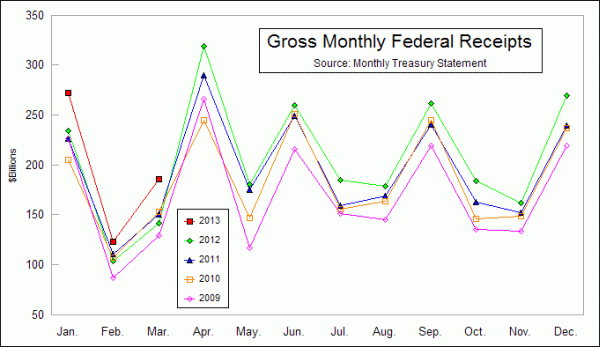 Total dollars collected for the first calendar quarter of 2013 equal $581 billion. That’s still less than the $888 billion that Uncle Sam spent from January to March, but the numbers are getting closer to each other. That’s good news for the deficit, but not such good news for the economy. Taking too much money out of the economy in the form of taxes stifles private economic activity. Those dollars don’t get to do other things when Uncle Sam snatches them up. In 2012, the first 3 months saw $479 billion in total federal receipts. So 2013 is already running 21% higher than the rate of gross federal receipts in 2012. There is a huge seasonality factor in when those dollars get sent to Washington, DC, as the second chart shows, but so far 2013 appears to be following that seasonal pattern quite well, with a big overall bump in total collections. April is understandably the biggest month, as people wait until the tax filing deadline to pay what they might owe for the prior year plus estimated taxes for the current year. Extrapolating forward, if the rest of 2013 continues to see federal tax receipts come in at a rate 21% higher than last year, and if GDP growth remains tepid, then trailing 12-month federal receipts will be up above that 18% recession threshold before the end of the year. Total dollars collected for the first calendar quarter of 2013 equal $581 billion. That’s still less than the $888 billion that Uncle Sam spent from January to March, but the numbers are getting closer to each other. That’s good news for the deficit, but not such good news for the economy. Taking too much money out of the economy in the form of taxes stifles private economic activity. Those dollars don’t get to do other things when Uncle Sam snatches them up. In 2012, the first 3 months saw $479 billion in total federal receipts. So 2013 is already running 21% higher than the rate of gross federal receipts in 2012. There is a huge seasonality factor in when those dollars get sent to Washington, DC, as the second chart shows, but so far 2013 appears to be following that seasonal pattern quite well, with a big overall bump in total collections. April is understandably the biggest month, as people wait until the tax filing deadline to pay what they might owe for the prior year plus estimated taxes for the current year. Extrapolating forward, if the rest of 2013 continues to see federal tax receipts come in at a rate 21% higher than last year, and if GDP growth remains tepid, then trailing 12-month federal receipts will be up above that 18% recession threshold before the end of the year.
It may be worth noting that during the late 1990s, federal tax receipts were able to stay up above 18% for quite a while before the recession was finally declared in late 2000. That was an exceptional time, when the Baby Boom generation was still fully employed and contributing to GDP, and when a technology bubble and deregulation had companies hiring and expanding. We don’t have those conditions now, with Boomers now retiring, and with federal regulations increasing dramatically. The high taxes back then did have their effect, though, causing the NYSE A-D Line to peak in 1998, killing the tech boom, and causing a change in 2000 for control of the White House.
Some people already understand that setting federal tax collections too high has this destructive power. Others have to be reminded about that every few years, a process which is now getting under way.
Tom McClellan
Editor, The McClellan Market Report
www.mcoscillator.com
(253) 581-4889
Related Charts
Chart In Focus Home >
|