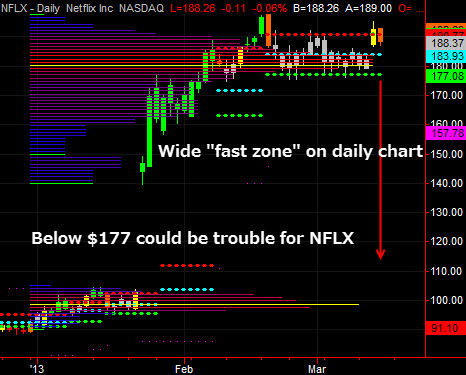
Looking strictly at the tecnhicals for Netflix (NFLX) it is evident that there is a line in the sand that if the price falls through could end up to be a bigger sinkhole than what has been seen in Florida lately.
The chart below shows that below the $177.08 key support line. The same number is appearing on the weekly chart and tells us that there is an important inflection point there that may be tested. The three horizontal lines are a representation of a Market Profile based on specific trading algorithms.
We added the Market Profile Map (shown here in Tradestation) that further confirms the lack of any real buying conviction that took place on the rise above $160.
(Note: These indicators (an more) are soon being made available through athe TPR joint venture with TAS Professional. If you use Trade Ninja, eSignal, OpenEcry or MT4, you can find out more at TASmarketprofile.com. It is also available on Bloomberg Professional and soon to be in the TradeStation Strategy Network.)
* – Horowitz & Company clients have recently initiated a short position in NFLX