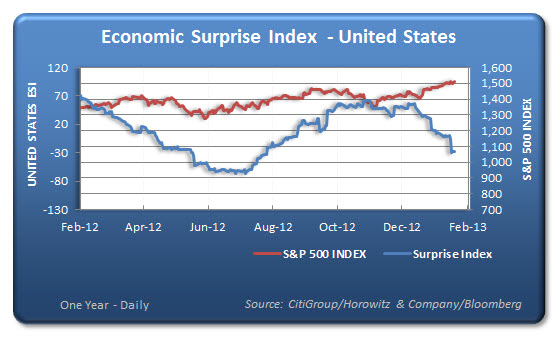
There have been many negative surprises recently related to the eco data in the U.S. and that is telling us something. Even though there have been some points that have been resilient (manufacturing), the overall results have not been very bullish. Yet, the markets are reading the positive surprises as reason to continue pumping money into stocks.
Over the years, there has been a reasonably high correlation to the performance of equities to the Economic Surprise Index (ESI). When that correlation breaks down there is usually a move to correct that within a few months. The first chart below shows a comparison of the trend of both the ESI and the S&P 500 index over the past year.
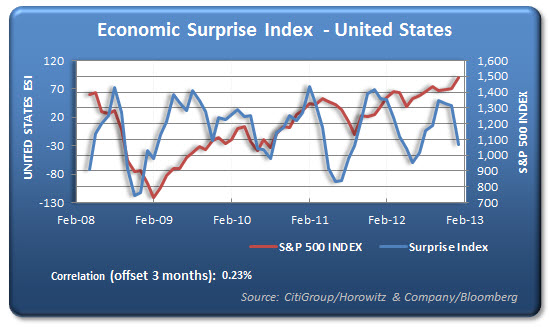
This next chart provides a comparison of the same information, over a longer time span, but with the S&P 500 lagged by 3 months. Note that there is often a period of overshooting by the S&P and then correction back toward the trend of the ESI. What we are now finding is that this overshoot is reason to be alert and looking for signs that this may be a time to keep some defensive positioning ready to implement.
Definition:
The Citigroup Economic Surprise Indices are objective and quantitative measures of economic news. They are defined as weighted historical standard deviations of data surprises (actual releases vs Bloomberg survey median). A positive reading of the Economic Surprise Index suggests that economic releases have on balance been beating consensus.
The indices are calculated daily in a rolling three-month window.The weights of economic indicators are derived from relative high-frequency spot FX impacts of 1 standard deviation data surprises. The indices also employ a time decay function to replicate the limited memory of markets.