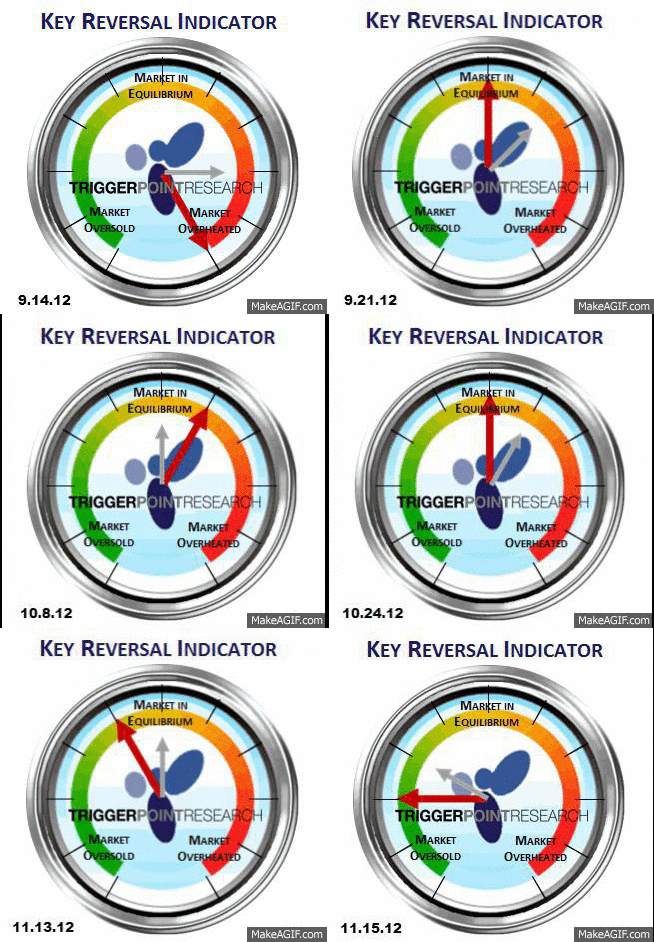
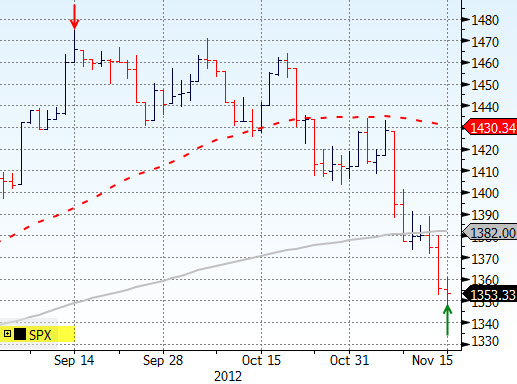
This is a good way to look at just how this indicator can look for market inflection points and when a counter-trend move could be soon appearing.
Notice first that the most overheated area occurred on September 14th. That is marked on the S&P 500 chart below.
Also, on the gauge, watch the dates on the lower left as it cycles from September 14 – November 15.


