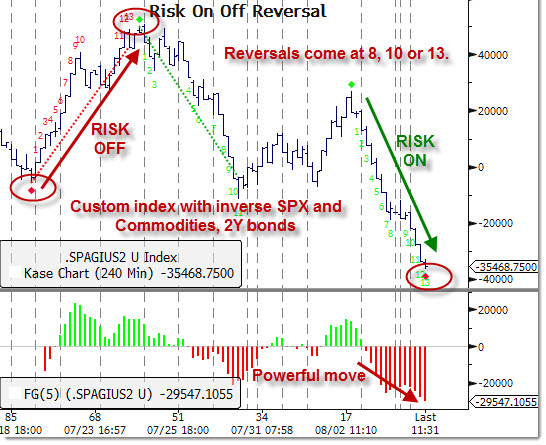
We have put together an indicator that helps to uncover some short-term reversals of trend. As the conditions of late have shown fits and spurts for markets, we thought that if there was a better way to gauge the potential short-term trend, that would be of benefit.
Remember, a few days euphoria has been met by panic several times in the past months. So, we created a custom index of short-term bonds, commodities and the S&P 500 index. It is actually is made up of short commodities as well as stocks and is long bonds.
So, when the trend of the custom index is UP, it is bearish for stocks and DOWN it is bullish. The key to this is the Kase Bar studies and the candle count. Reversals come at 8, 10 or 13. We are now at a 13 that has just been recorded and the reversal will register if there is a change.
The trick is to wait for the change and confirmation. Notice that a 13 count was registered on 7/24 that reversed and the lower panel confirmed that the trend had peaked. Right now we are still looking at a bullish mode that is peaking at a much lower level than we have seen. Of course this does not necessarily mean that there will be an immediate reversal, however, it does show signs of exhaustion (which could persist until a turn is confirmed).
At the same time, there are a few other indicators that are getting a bit hot and that is also worth noting, but not specifically acting on just yet. When/if a clear reversal comes and it is confirmed, we will update it here and on our Twitter stream.
A discussion about Kase Bars from Bloomberg Technical dept:
The two major ways that Kase Bars will help you trades are 1) reduced risk and 2) cleaner signals without the insertion of fictitious data.
1) Volatility and risk are directly related, and volatility is proportional to True Range. The more variation there is in the True Range from bar to bar, the more risk there is. Kase Bars reduce risk by about a factor of 4, so where one might need to place a stop at $2.00 with normal time bars, with Kase Bars, the stop may only need to be placed at $0.50.
2) Reduced false signals and signals earlier and at better prices take place with the Kase bars. In a recent study on the Stochastic and MACD with Kase versus minute bars, it was found that Kase bars trigger signals
- Reduced false signals overall, Kase Bars generated over 40% fewer false signals, that is divergence signals that didn‘t result in turns were reduced by over 40%
- Faster signals Kase Bars generated divergences about 50% earlier for day session trades (so when compared with a 60 minute chart, 30 minutes sooner)
- Kase Bars generated signals at prices 30% better– so if the Average True Range is $1.00, which would be equivalent to $0.30 per signal.
Live and Alerting
(Click the above for more information)


