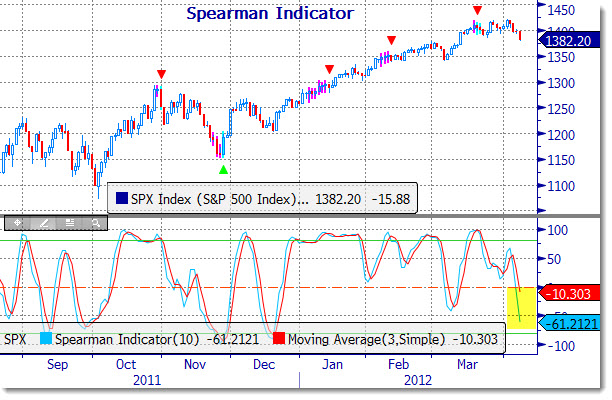
Back on March 26th, we wrote that the Spearman Indicator was showing signs that a change in trend was possible. At that time, there was a hint that markets were vulnerable, but there was no definitive confirmation.
Now that our Market Trend Indicator (MTI) is in a Strong Downtrend position, it is confirmed that the roll under the zero mark for the Spearman has also flashed a change in trend. It is important to look at multiple indications of market trend in order to better understand the potential when considering investment opportunities.
Even though the Strong Downtrend is confirmed, it is not time to throw out positions that continue to work. Rather, it is a signal for extreme caution as the trend has an overriding pull on almost all stocks.
One further note: The volume action Monday was lighter than the 10 day average showing that hedgies and institutions are not pulling the plug just yet.
Along with the Spearman Indicator, we have also plotted the Bloomberg Trend/Stall Study:
TrendStall identifies points at which a trend is losing momentum and is likely to stall or consolidate. The determination is based on a Rate of Change of the ADX. The parameters for the ADX, Rate of Change, and Moving Average of the Rate of Change are user adjustable.
The bar that has been determined to be the `Stall‘ point is marked by a triangle above or below that bar. The price bars leading up to a TrendStall signal are painted a different color to alert the user that the TrendStall histogram has risen above the threshold level confirming a trend is in place and a stall is imminent. The period after the stall bar may also be painted on the price chart, depending on the value of the histogram (ADX ROC) in relation to a moving average of that value. This `paintbar‘ period is often valuable as an indication of a slightly longer stall confirmation.
Live and Alerting
(Click the above for more information)


