There is an important link between confidence and market direction. If there is a feeling of uncertainty, there is often a lack of commitment. Therefore, stocks will not be in favor.
The flip side is also true. Reading the tea leaves to predict market direction is not an easy task and there is no one that I know of that can do it consistently. But, there are a few indicators that help to better understand the underlying positioning that may provide a hint as to where things may go and when they will turn.
Most often, the extreme levels are what we want to look for and confirmation across several measures is always good. The series of charts and data below are some of the more commonly used by market watchers.
What does all of this tell us? It appears as if it is a toss up at this point, but leaning toward the bearish case. Either the bulls or the bears can take the ball from here….
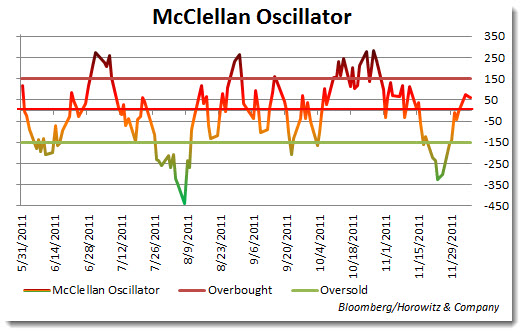
McClellan Oscillator – Reading: Neutral
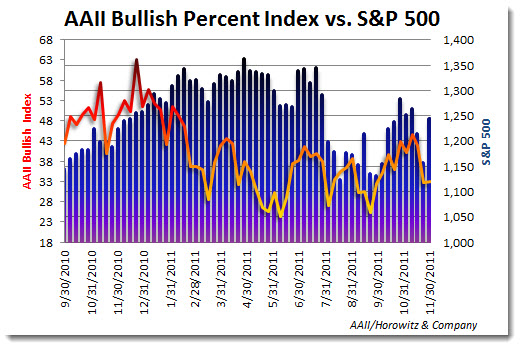
AAII Bullish Percent: Reading – Slightly bearish (contra-indicator)
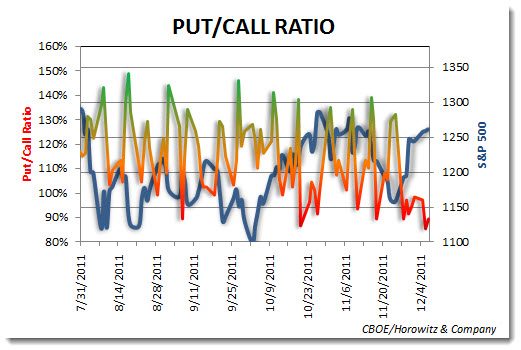
CBOE Put/Call Ratio: Reading – Extreme (Bearish)
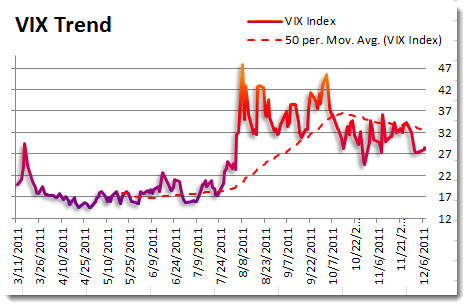
VIX Index: Reading – Below average (Slightly Bearish)
___
Looking to invest in The Disciplined Investor Managed Growth Strategy? Click HERE for the virtual tour….
___


