We looked to find some potential bounce candidates that are nearing their 50 Day Moving Average. Below are a list of the tickers, description and the criteria for screening:
All United States Exchanges
Average Daily Volume > 700,000
Price > $8.00
Price 3 Months Ago < Current Price (Establishes that stock is in an uptrend)
Price 2 Weeks Ago is > Current Price (Establishes that stock is in a short-term pull back)
50 Day MA < Price < 50 Day MA*1%+50 Day MA (This basically says that the price is between the 50 Day Moving average and 1% above the 50 Day Moving Average.
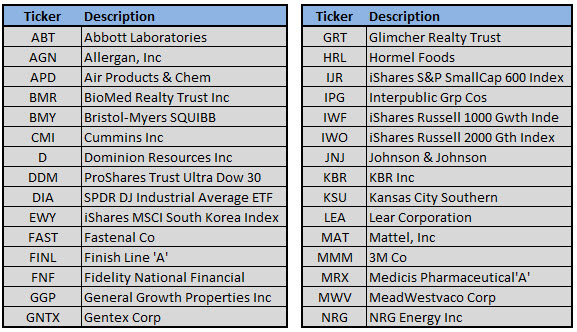
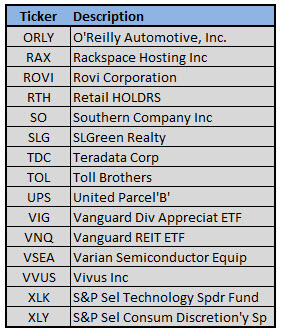
Scroll down to see a chart of these stocks on this screen. Click to enlarge