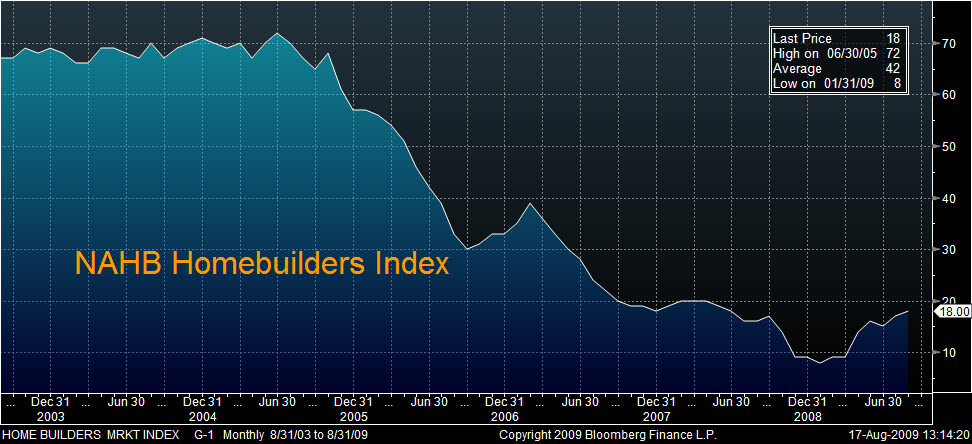
The South is really not doing well and overall the NAHB Homebuilders index is also suffering from total stagnation. While we are seeing a bit of improvement in the FUTURE index, the PRESENT index is stable at best. This is not what the markets are looking for at these levels. So, maybe next month…
U.S. Home Builders‘ Aug. Index Rises to 18: Summary (Table)
By Chris Middleton
Aug. 17 (Bloomberg) — Following is a summary of U.S. housing
activity from the National Association of Home Builders/Wells Fargo.
*T
===============================================================================
Aug. July June May April March 6 mo
2009 2009 2009 2009 2009 2009 Avg.
===============================================================================
———————–Index——————–
Housing Market Index 18 17 15 16 14 9 15
Single family sales: Present 16 16 14 14 12 8 13
Single family sales: Future 30 26 26 27 24 15 25
Prospective Buyers Traffic 16 13 13 13 13 9 13
——————Monthly Change—————-
Housing Market Index 1 2 -1 2 5 0 n/a
Single family sales: Present 0 2 0 2 4 1 n/a
Single family sales: Future 4 0 -1 3 9 0 n/a
Prospective Buyers Traffic 3 0 0 0 4 -2 n/a
——————-Yearly Change—————-
Housing Market Index 2 1 -3 -3 -6 -11 n/a
===============================================================================
Aug. July June May April March 6 mo
2009 2009 2009 2009 2009 2009 Avg.
===============================================================================
Single family sales: Present 0 1 -3 -3 -6 -12 n/a
Single family sales: Future 6 3 -1 -1 -6 -11 n/a
Prospective Buyers Traffic 3 1 -3 -5 -6 -10 n/a
—- Prospective Buyers Traffic in New Homes —-
Regional HMI Northeast 24 16 19 19 15 8 17
Regional HMI Midwest 16 14 14 14 14 8 13
Regional HMI South 18 19 15 18 17 12 17
Regional HMI West 17 14 15 12 8 5 12
===============================================================================
NOTE: The HMI and components are seasonally adjusted
Future refers to starts in next six months.
The survey is based on 474 builder respondents.
Disclosure: Horowitz & Company clients may hold positions of securities mentioned as of the date published.


