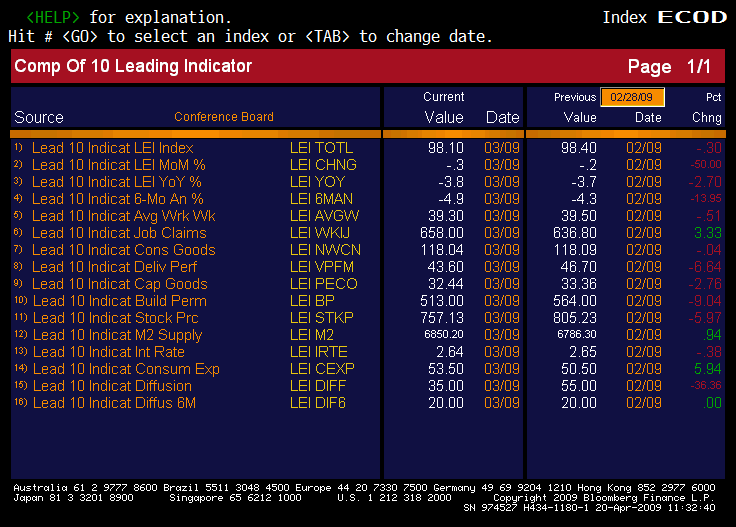
From the looks at this morning’s economic announcement, we are clearly no out of the woods just yet. In fact, the table below suggests that almost all of the components of the Conference Boards leading indicators are showing a continuation of the move lower.
Again, the green shoots that have been discussed are more like little weeds that are still growing on our dirt filled economy foundation.
(CLICK TO ENLARGE)
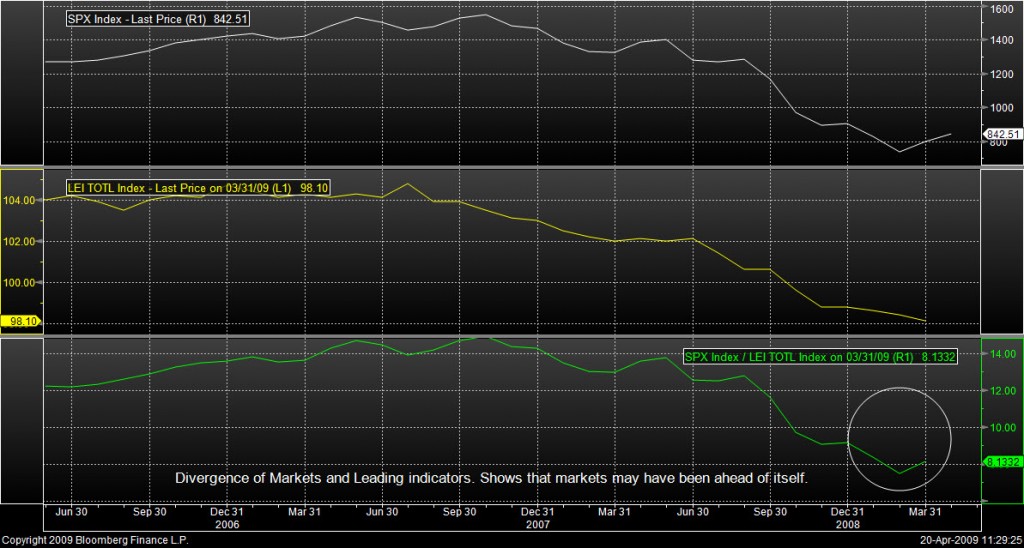
The chart above shows the S&P 500 index and the Leading Indicators Index in its raw form. The lower part of the chart shows a ratio that looks as if there was a divergence in the last month that spells a potential drop for stocks as enthusiasm was not grounded in reality.
Below is the table that breaks down the components of the leading indicators.
This could be the break from the hollow rally we saw and now will begin to turn the portfolio to a greater short position as we believe there is much more pain that will come. Of course the change will be somewhat gradual as we will watch for bounces by the blind bulls ( especially at the 3pm hours of each day).
(CLICK TO ENLARGE)


